What Is and What Is Not Traceability? The Most Common Myths
Growing quality requirements, increasingly stringent legal regulations, and customer expectations regarding production transparency mean that traceability is becoming one of the pillars of modern production management. Despite this, many misconceptions still surround it. Companies often invest in it while only partially implementing the idea of product traceability.
Production Under Scrutiny: What Traceability Tells Us
What exactly is traceability, and what can it offer to manufacturing companies? What areas of the process does it cover, and what are its types? Is it merely a regulatory requirement – or a practical tool supporting production efficiency and safety?
From Paper Documentation to Full Traceability. The Digital Transformation at OnlyBio.life
Millions of items annually, hundreds of formulas, continuous product launches, adherence to strict quality standards and GMP requirements, multiple legal obligations – this is the reality of many FMCG companies. In such an environment, traceability is no longer a nice-to-have addition, but a necessity. Moreover, its dependable performance is the condition for a business’s stable growth.
Digital Technologies and Strategies for Increasing Energy Efficiency
We live in an era of spectacular changes — Technological, Economic, and Business-related. Changes we can prepare for, and those that surprise us day by day.
Boost Productivity with AI. ImFactory and Braincube
Your manufacturing data may hold far greater potential than you think. Find out how to unlock it and genuinely boost efficiency — without costly investments in new infrastructure.
How to resolve manufacturing issues? First of all, you need to pinpoint their origins and gather comprehensive information about the events in question. To navigate this labyrinth of anomalies that occasionally plague production processes, a reliable guide is often indispensable: the Overall Equipment Efficiency (OEE) indicator.
Manufacturing issues impact companies of all sizes and industries. They affect even the most capable managers and leaders, persisting despite the presence of the most dedicated, qualified employees, and advanced machinery and systems. However, minimizing losses is possible. So, where should you begin when searching for the root cause of manufacturing issues, and how can you effectively identify them? This story could have taken place in any manufacturing company.
Where to start looking for the root causes of manufacturing issues?
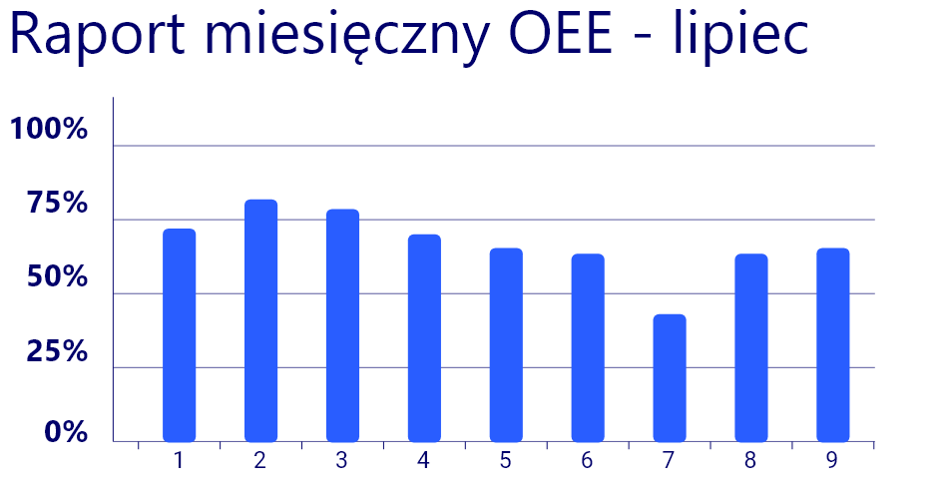
Imagine a factory where a board member analyzed a monthly report and noticed a disturbingly low OEE on a particular day, clearly indicating manufacturing issues. Immediately, the board member sought clarification from the production leader regarding this poor performance.
According to the general OEE report, manufacturing issues occurred on the 7th of July. Source: ImFactory
To determine the root cause of the low OEE, the leader needed to take several actions. The report indicated that something had gone wrong but lacked specific details about the problem’s root cause. The leader’s initial step was to generate reports for all the equipment used in the factory that day.
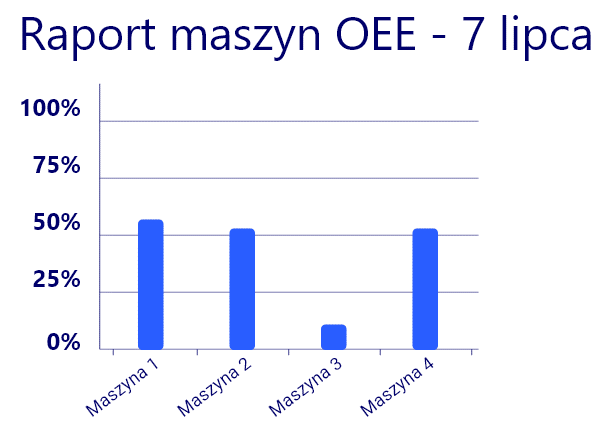
Upon studying the reports, the leader observed that the OEE for all the equipment was slightly lower that day, with one machine standing out significantly. Consequently, the next logical step involved examining the effectiveness of that particular machine on the given day. The OEE report generated for this specific machine served as an invaluable source of information.
An OEE report highlights machines requiring closer investigation. Source: ImFactory
How analyzing an OEE report helps identify manufacturing issues
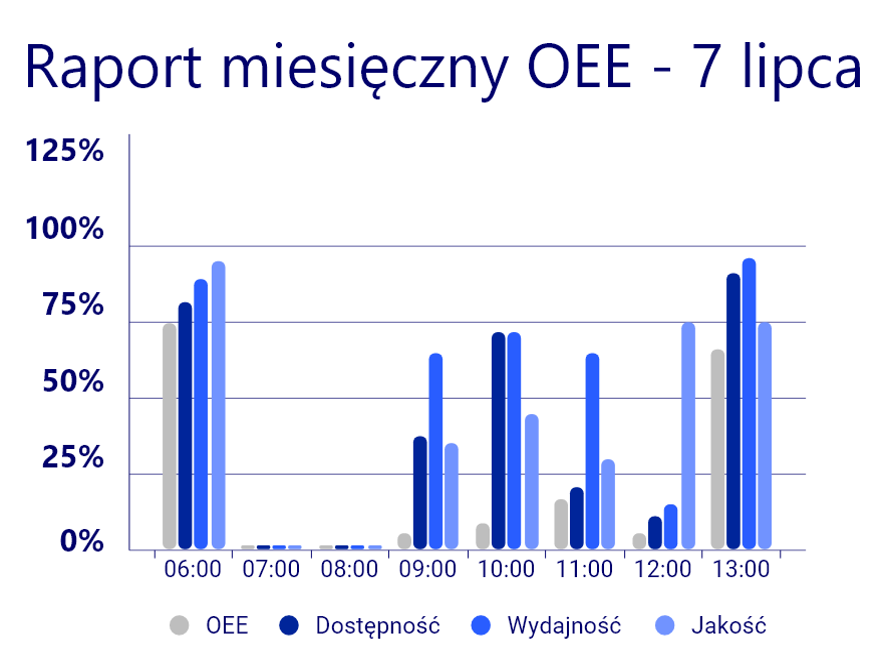
While scrutinizing the OEE report for the machine, the production leader not only considered the overall OEE score but also delved into its components: availability, performance, and quality. This comprehensive analysis provided detailed insights to pinpoint the source of the problem.
The leader promptly identified anomalies within the OEE and its components. Throughout the day, the overall OEE score remained consistently low, dropping to almost 0 at times. Only at the beginning and end of the shift were the results relatively satisfactory. Analyzing the individual components of OEE, the leader noticed that the factor negatively affecting performance, even between 7:00 and 8:00, appeared to be a significant drop in availability, leading to a halt in manufacturing. In the subsequent hours, availability improved but then dropped again. Whenever the machine was operating, availability was slightly lower, and just before the final hour of the shift, it experienced a significant decline. Additionally, the quality level remained consistently below the usual standards throughout the day.
Analysis of OEE components provides detailed information. Source: ImFactory
This wealth of information indicates where manufacturing issues occurred, although resolving them remains a challenge. So, what would have been the leader’s next step? A logical choice was to compare the gathered information with the machine utilization report. This facilitated speculation about potential causes. Although the report did not provide explicit information about the root cause of manufacturing issues, it was evident that a major breakdown occurred from 7:00 to 8:00. The red color instantly caught the leader’s attention, indicating another breakdown during the latter part of the day, followed by a significant switchover.
By comparing an OEE report with a machine state report, further conclusions can be drawn. Source: ImFactory
With this information, the leader deduced that the drop in product quality was likely due to the operators needing to calibrate the machine between breakdowns, which probably resulted in the production of several test items. This caused a decline not only in quality but also in efficiency, as operating at the highest speed was impossible during calibration and test item production. Although the leader was still not certain about the exact cause, the OEE report provided valuable insights into the manufacturing issues.
Contacting the operator – unveiling the causes of manufacturing issues
Based on the information gathered in the previous steps, the leader drew the following conclusions:
Two major breakdowns occurred, leading to a decrease in availability.
After each breakdown, quality, performance, and availability declined, which was a natural consequence of calibrations and switchovers.
Once the failure was resolved and normal operation resumed, the OEE indicator returned to its usual level.
These insights provided a wealth of knowledge that could be put into action. However, to gain a better understanding of the root causes, the leader decided to delve deeper. The operator who operated the machine on that specific day would likely have the most relevant information. The leader arranged a conversation with the operator to obtain all the necessary details.
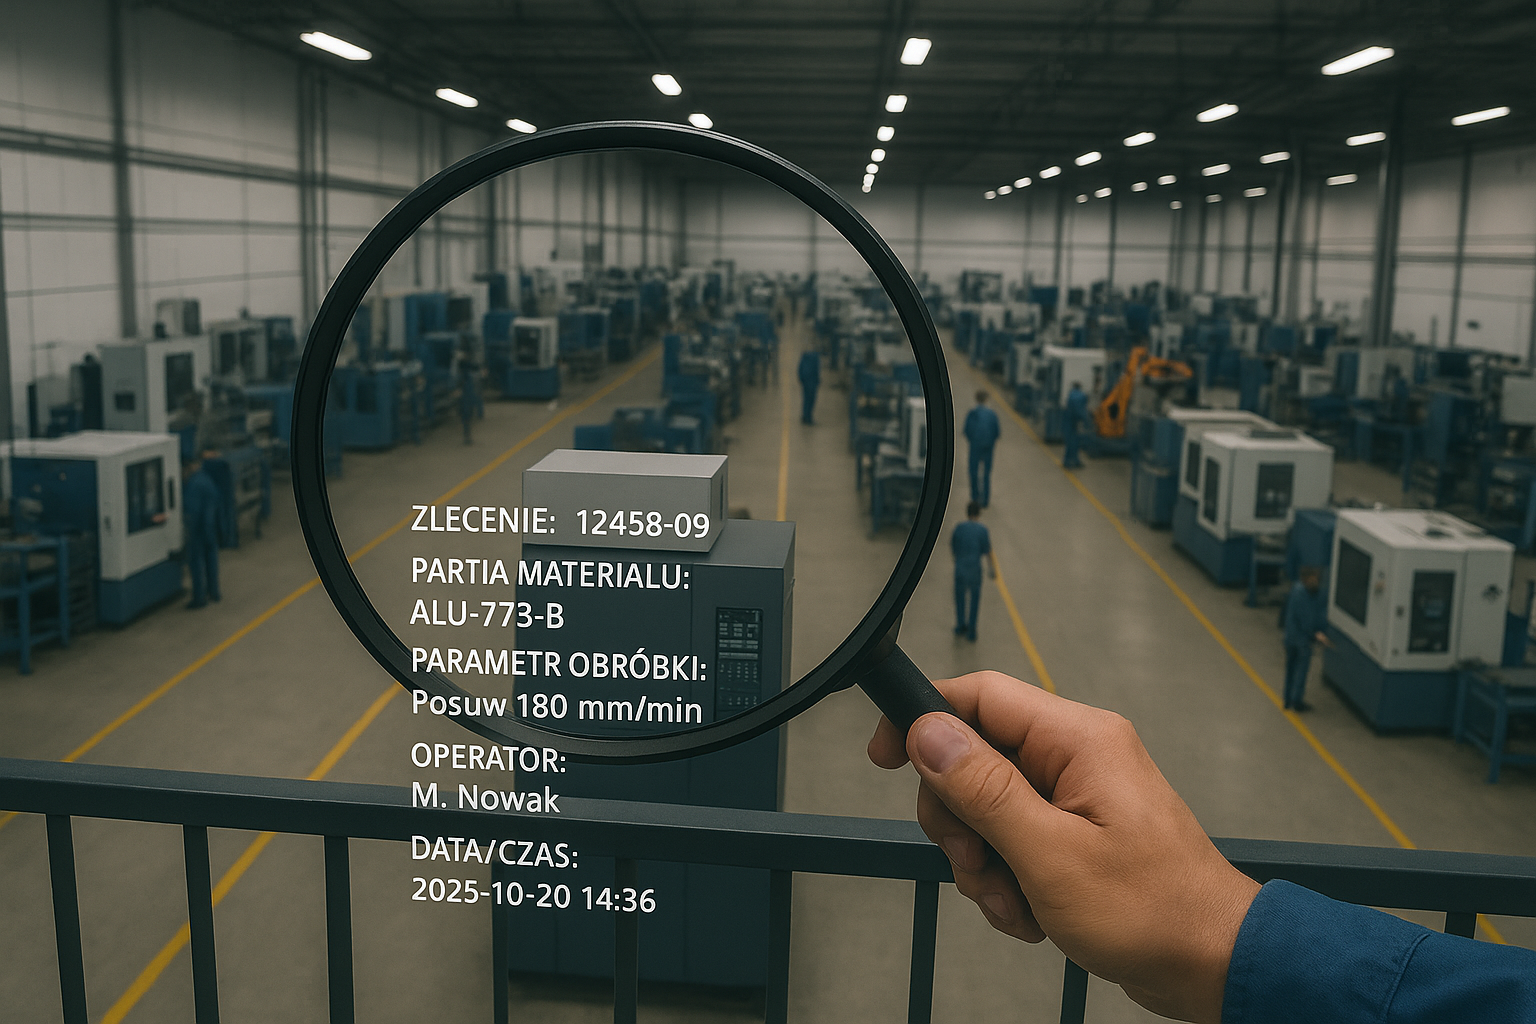
To identify the operator, the leader referred to the machine utilization report once again, which displayed the machine’s states minute by minute, including critical utilization reasons that could have caused serious manufacturing issues. What is more, an OEE report allows an operator to leave short comments, which often proves valuable in explaining unusual situations concisely. In this case, the breakdown was caused by a broken pivot.
A detailed machine utilization report displays critical states and reasons and enables operator comments. Source: ImFactory
Can different work strategies impact the OEE indicator?
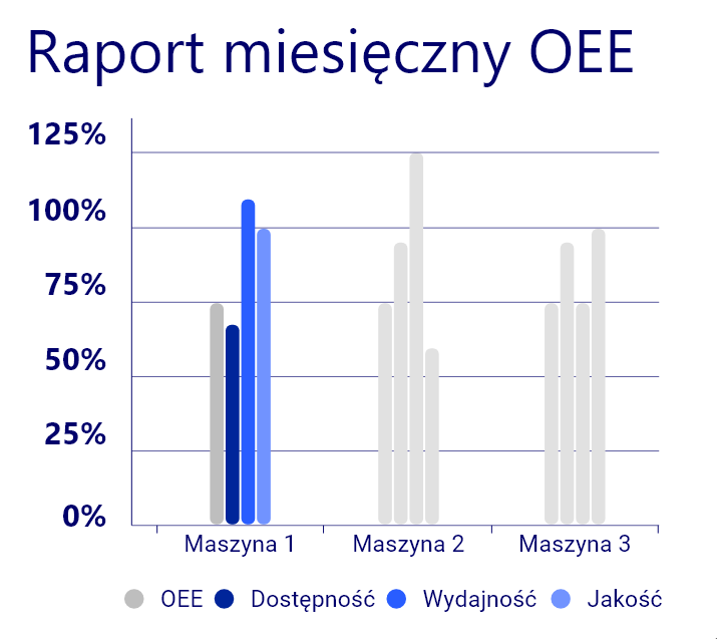
By analyzing the OEE report, our leader was able to uncover the manufacturing issues. However, is the OEE a reliable indicator of production efficiency? Can the strategies chosen by operators significantly affect its parameters, thus altering the data? Let’s consider three machines and analyze different scenarios in which three operators performed the same task following different strategies:
Strategy 1 – numerous stoppages:
In the first scenario, the operator worked with above-average efficiency and produced no faulty items – all items were of excellent quality. However, there was a slight decrease in availability, possibly due to various factors such as frequent breaks, slow switchovers, or unplanned stops. Consequently, the machine’s OEE was 75%.
Machine 1 report. Source: ImFactory
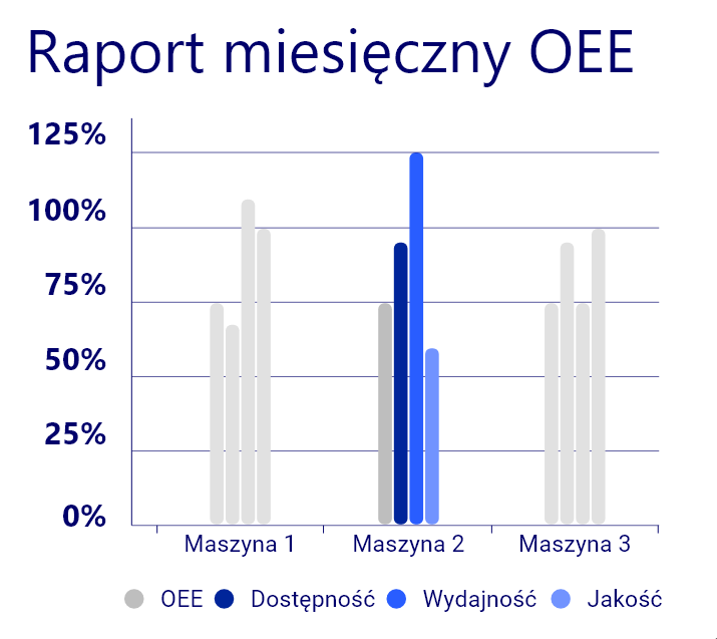
Strategy 2 – high-speed operation:
The second operator decided to increase the pace of work. Performance rose to 125%, and availability remained high. There were no extended breaks, and all stops and switchovers were planned. Unfortunately, the high speed led to a decrease in quality, with only 50% of items being good quality. However, due to the increased pace, there were still a significant number of good items. As a result, the OEE remained at 75% as well.
Machine 2 report. Source: ImFactory
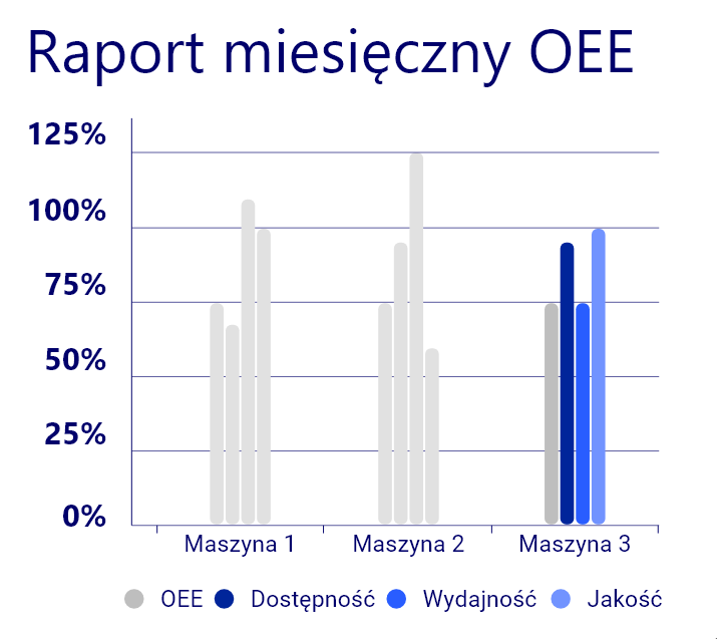
Strategy 3 – stable work:
The third operator opted for a steady working pace, not operating at the highest speed, and produced only good-quality items. There were no breaks or unplanned stops. This consistent approach resulted in an OEE of 75% as well.
Machine 3 report. Source: ImFactory
These examples demonstrate that regardless of the operator’s strategy, the OEE consistently reached the same level of 75%, indicating its reliability and immunity to malfunction.
Does the OEE always tell the truth?
The above story highlights the valuable role of data collected from machines, particularly the reports provided by the OEE indicator. It serves as a valuable source of information, not only regarding general production effectiveness but also for troubleshooting manufacturing issues. The examples presented demonstrate that the OEE indicator produces consistent results regardless of the work strategy employed, making it a reliable indicator for analyzing manufacturing issues and drawing valuable conclusions.
Author: Adam Pachałko, industrial software engineer, ImFactory
Adam Pachałko is an industrial software engineer who graduated in Automatic Control and Robotics from Gdansk University of Technology. He is an expert in MES and Business Intelligence systems. He took his first professional steps in the Improvement Factory, where he has spent the last four years developing Poland’s industrial software. His experience ranges from customer service and development to overseeing work in production facilities.
Adam Pachałko is an industrial software engineer who graduated in Automatic Control and Robotics from Gdansk University of Technology. He is an expert in MES and Business Intelligence systems. He took his first professional steps in the Improvement Factory, where he has spent the last four years developing Poland’s industrial software. His experience ranges from customera service and development to overseeing work in production facilities.
See also
Want to learn more? Visit our Knowledge Base, where you'll find articles and webinars by experts to expand your knowledge.
Check if Digital Transformation is the Answer to Your Company's Needs
Free Consultation
Thank you for submitting the form.
Our account manager will contact you within 1 business day to learn more about your challenges and schedule an appointment with the consultant best suited to your needs.
While you’re waiting, we encourage you to go to ImFactory’s Knowledge Base, where you’ll find many interesting webinars, articles and case studies that will introduce you to the world of Digital Transformation