Effective business analyst
Make business decisions based on actual data.

Convenient reporting and data analysis
Data aggregation from many different sources in the enterprise, their processing and presentation in graphical or tabular form using a web browser. It enables automatic reporting of predefined, key business indicators for the entire organization or narrow areas or individual machines.


Main functionalities
A complete set of features for efficient management and tracking of production at every stage of manufacturing.

Forms
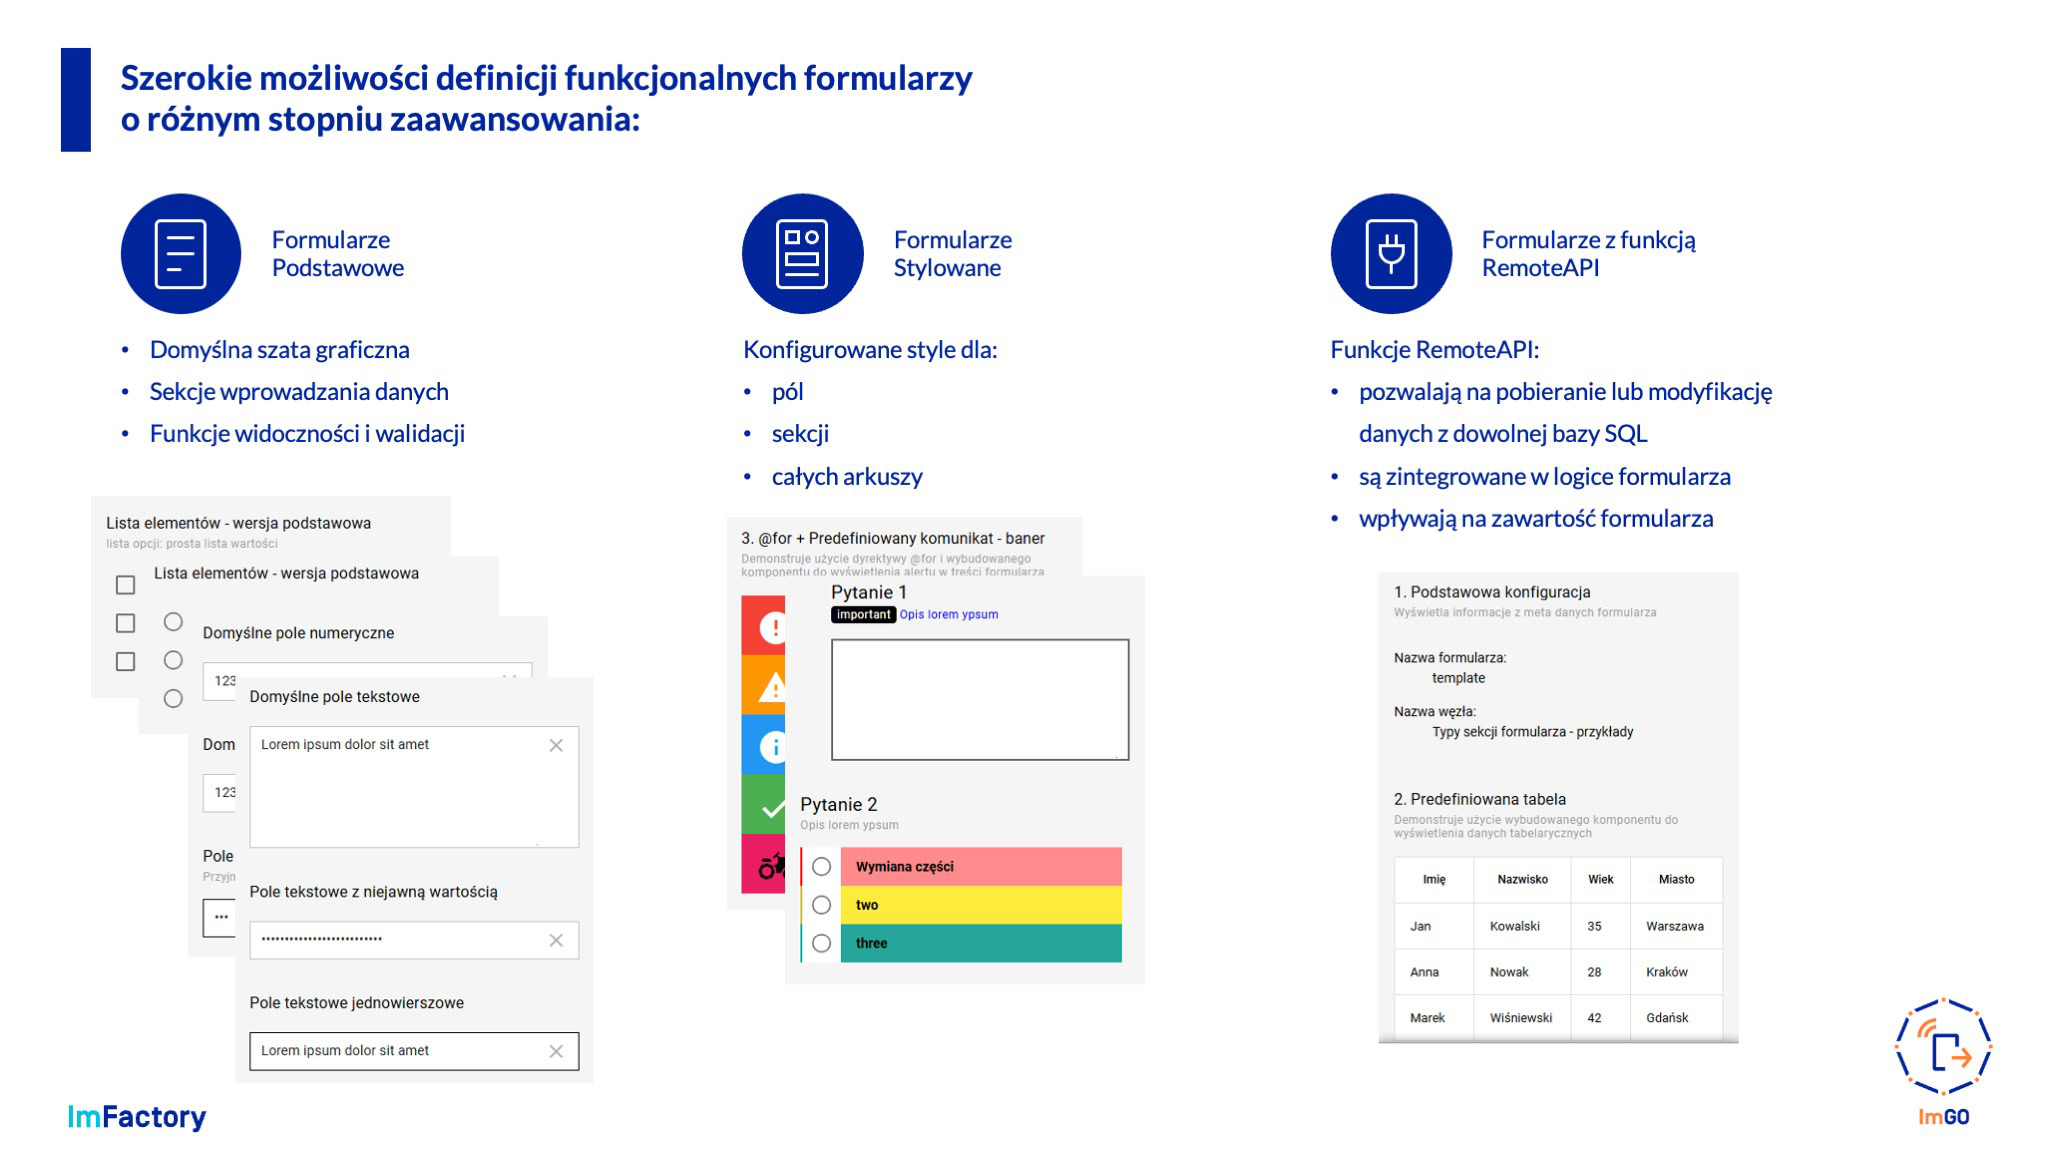
Wide possibilities of functional form definitions with different levels of complexity
Identification
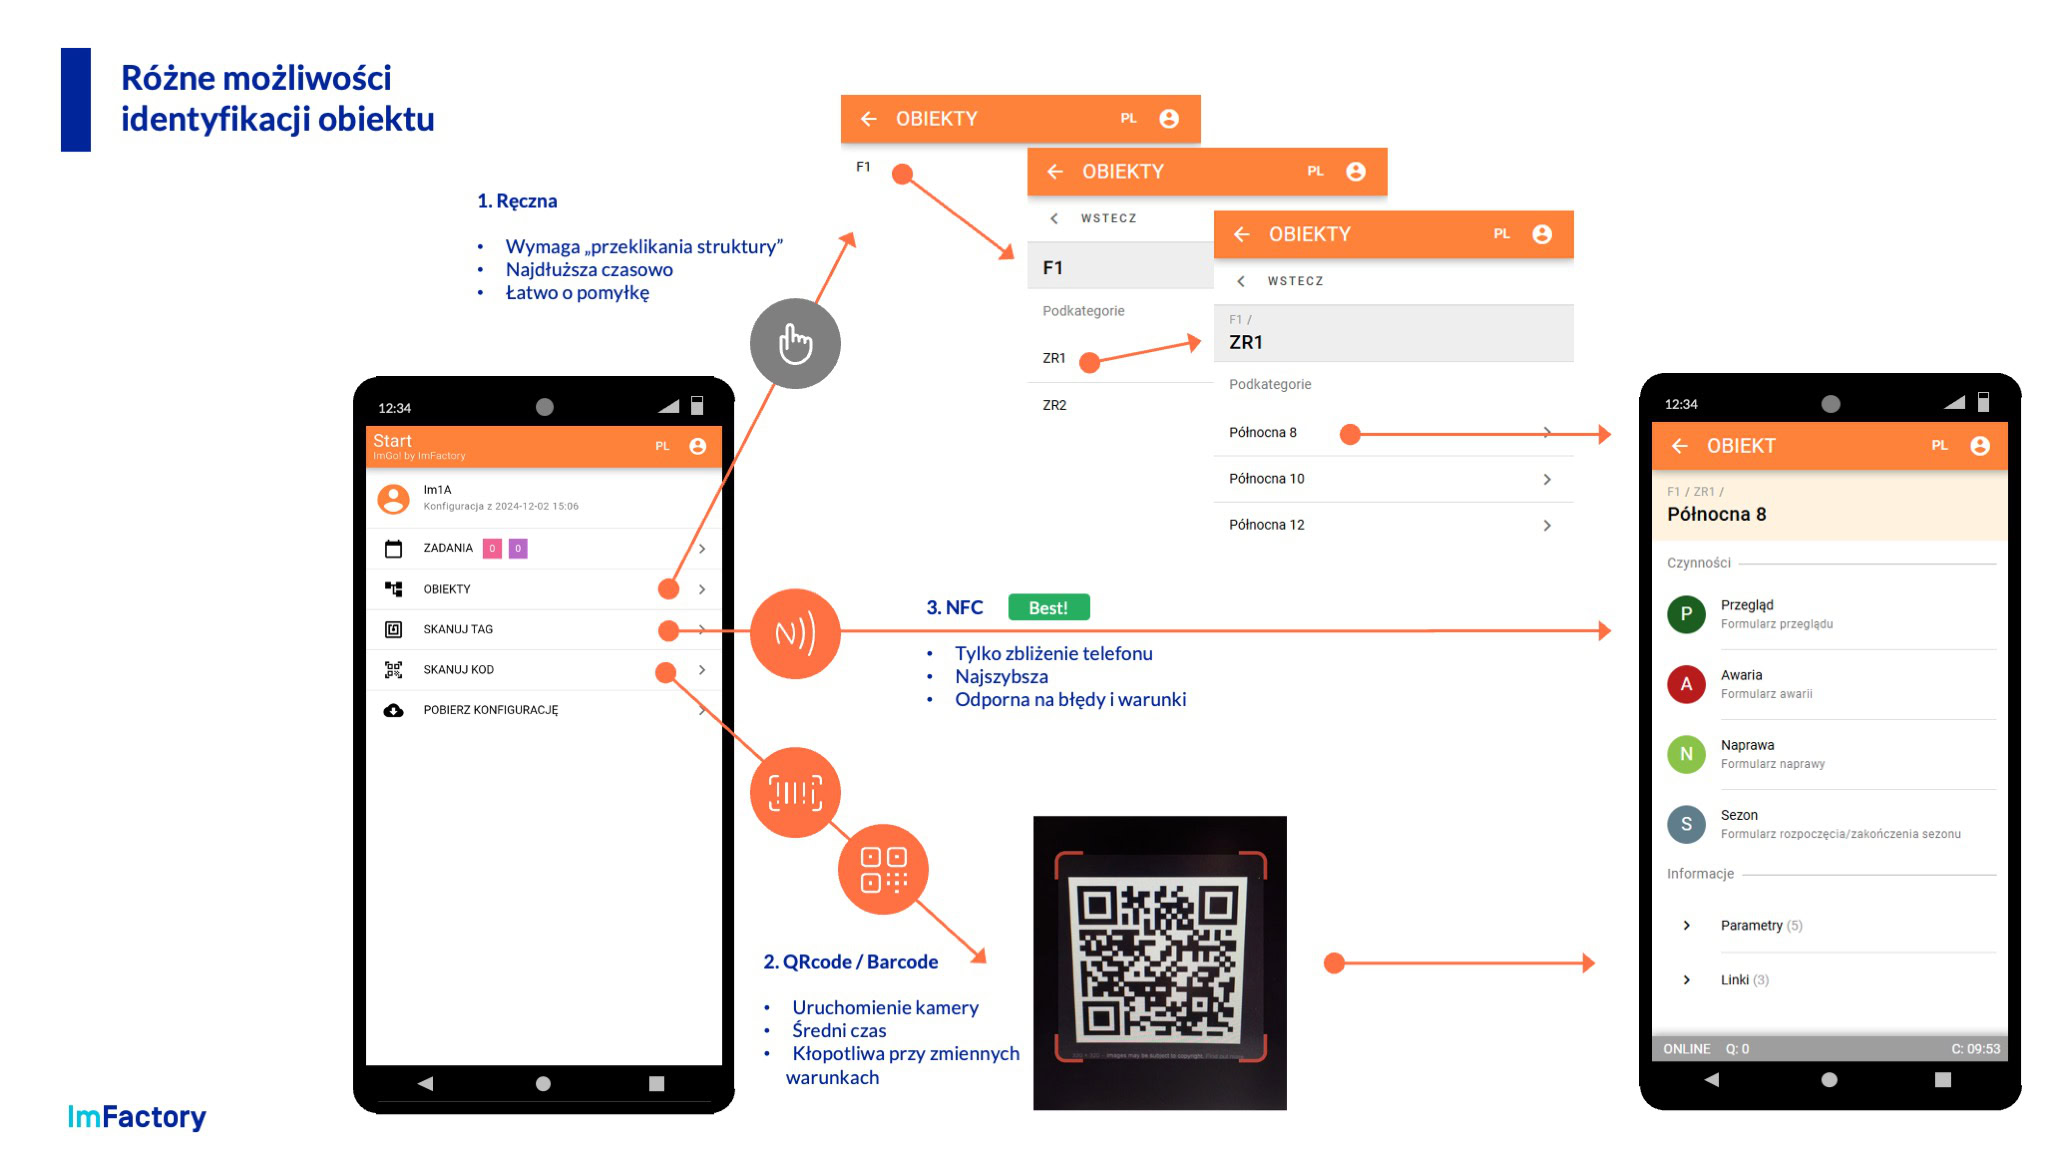
Various possibilities of object identification
Identification
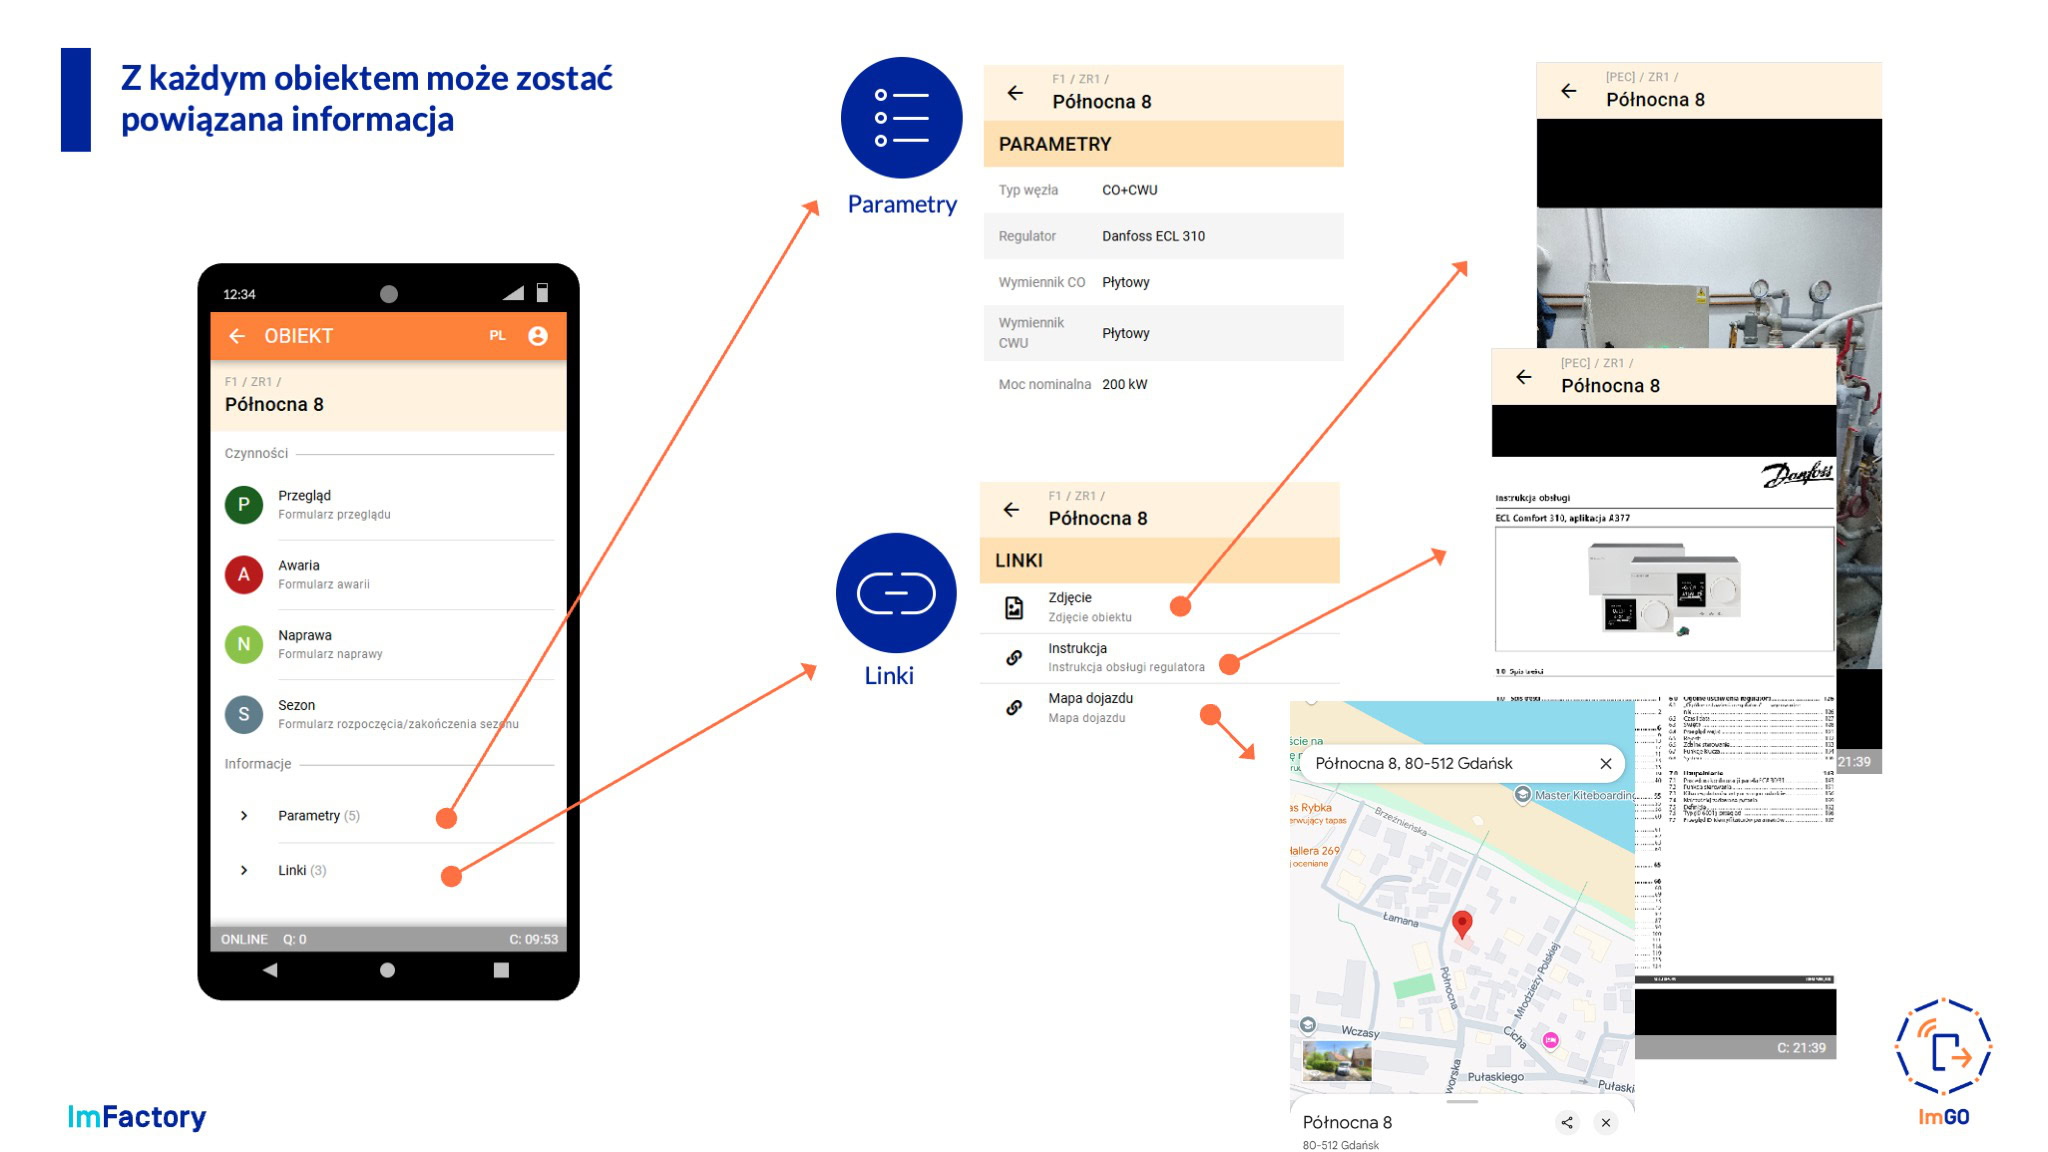
Information in the form of parameters, files and links can be associated with each object
Personalization
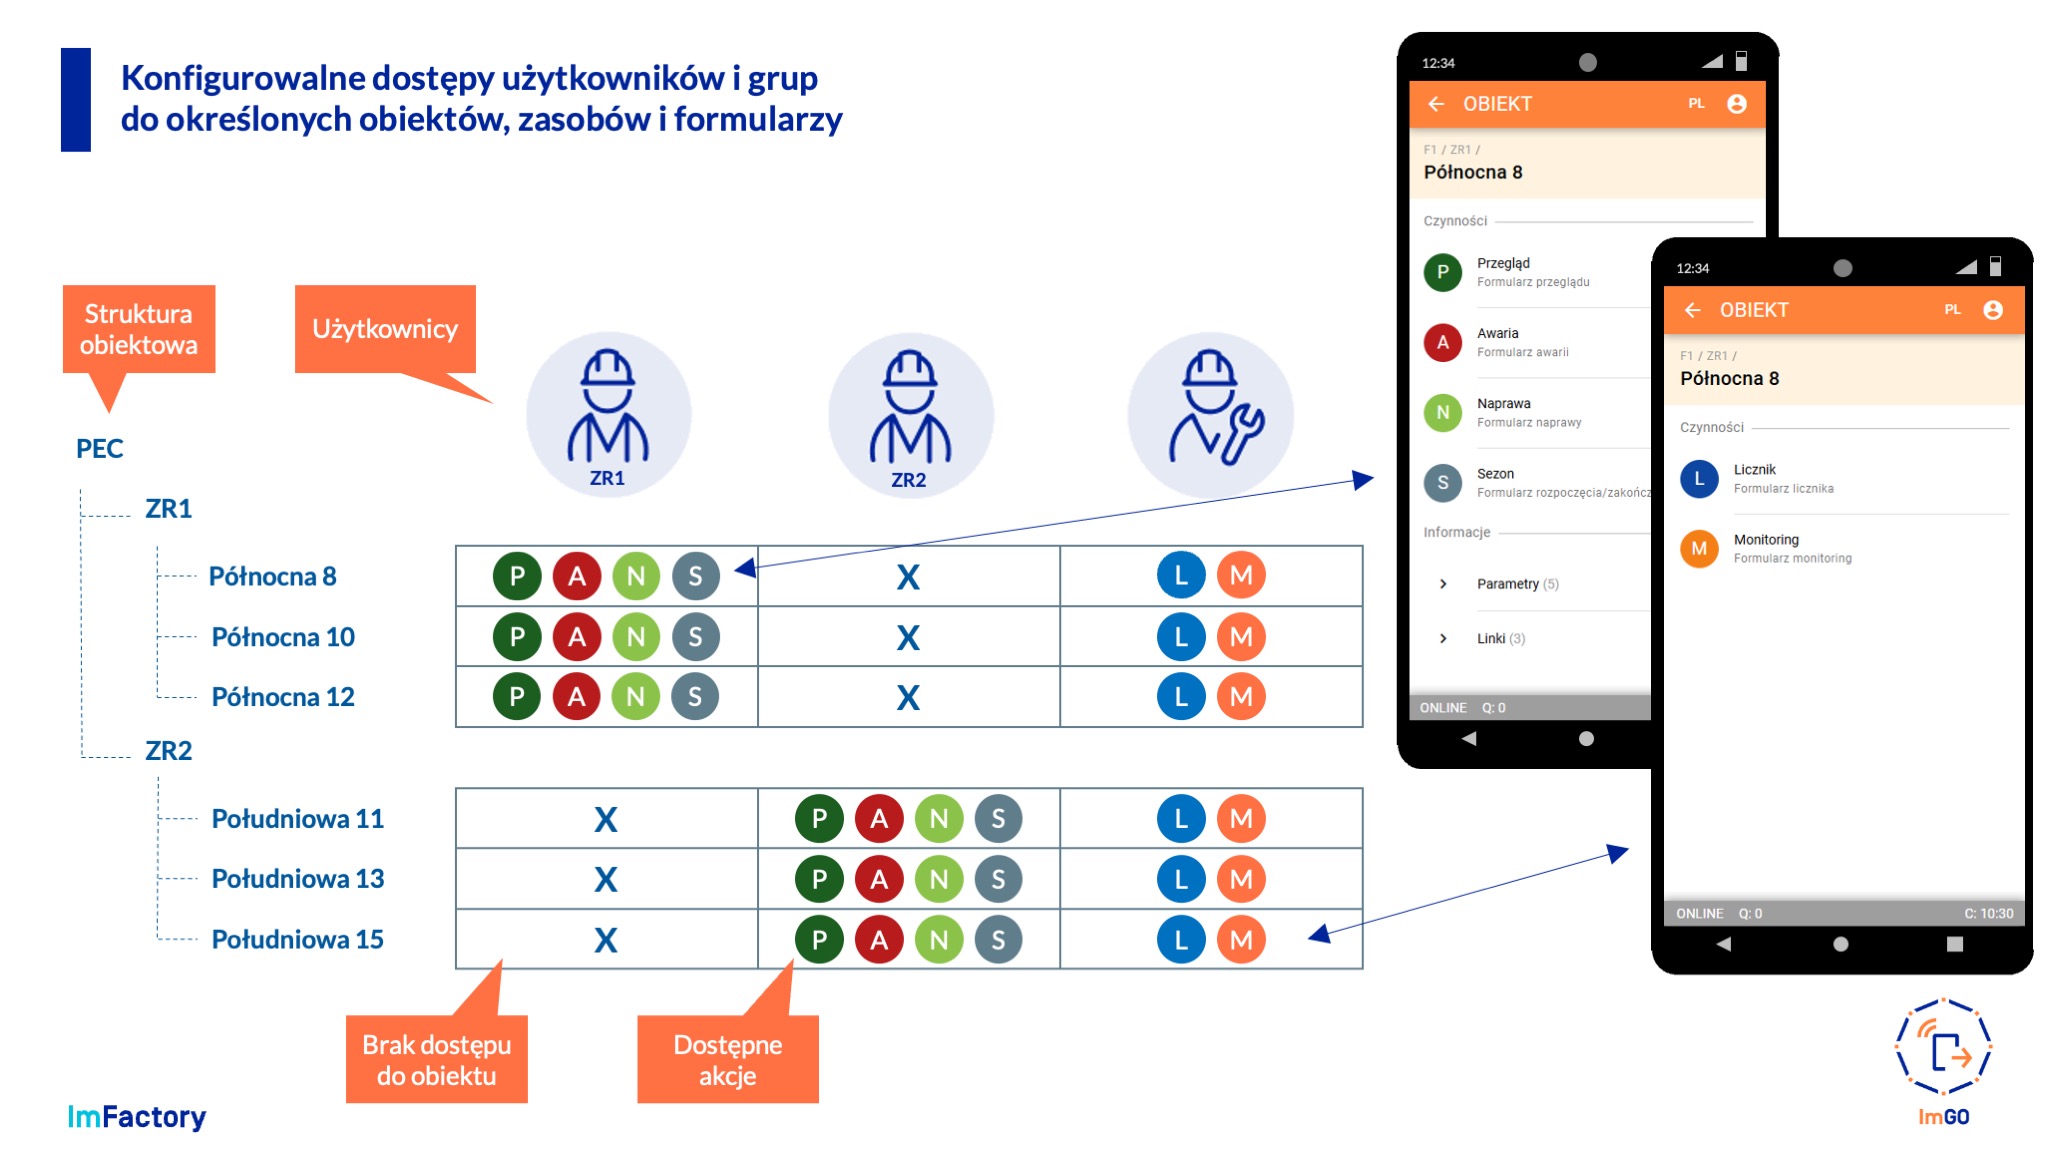
Configurable user and group access to specific objects, resources and forms
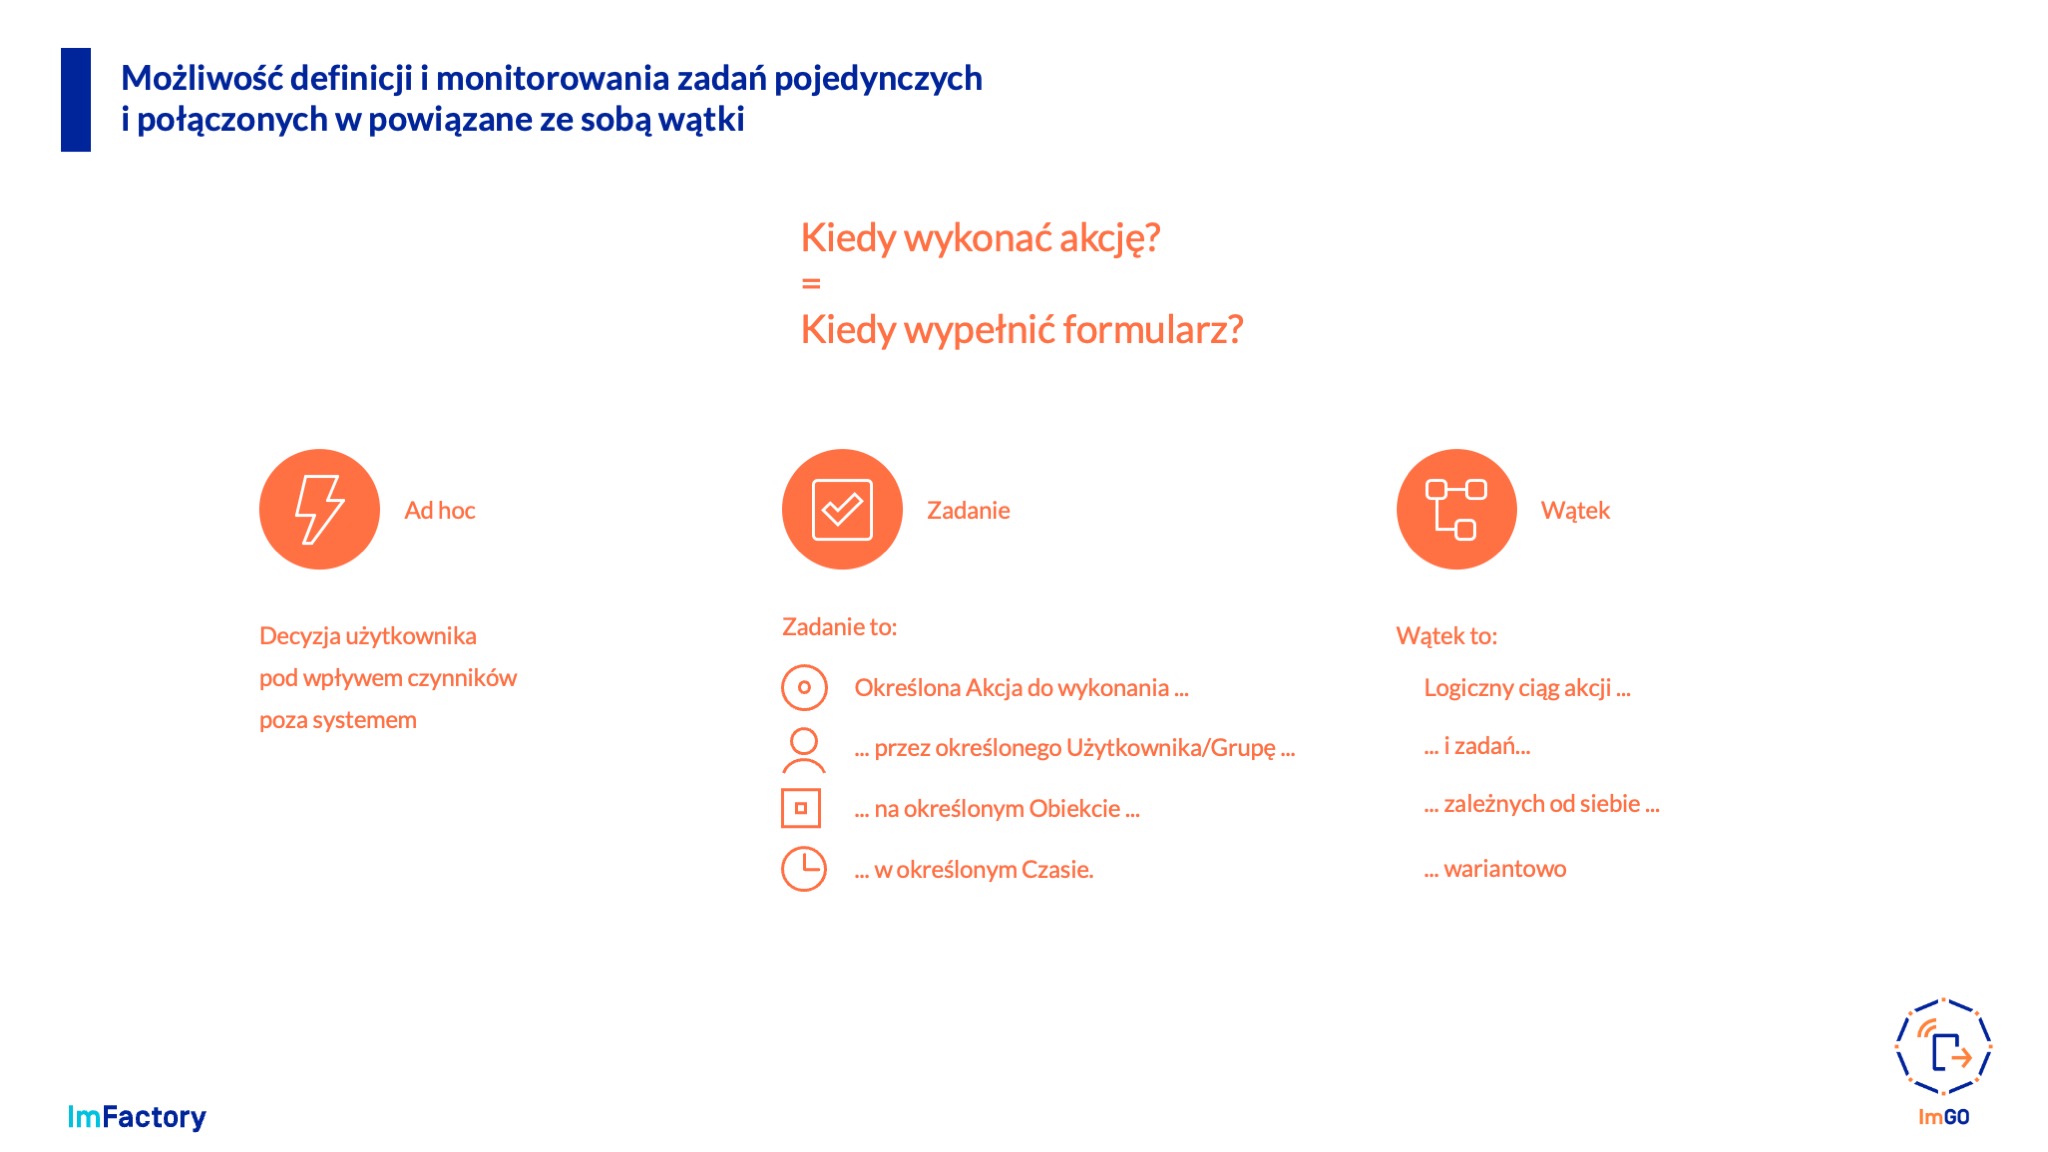
Workflow
Ability to define and monitor single and linked threaded tasks
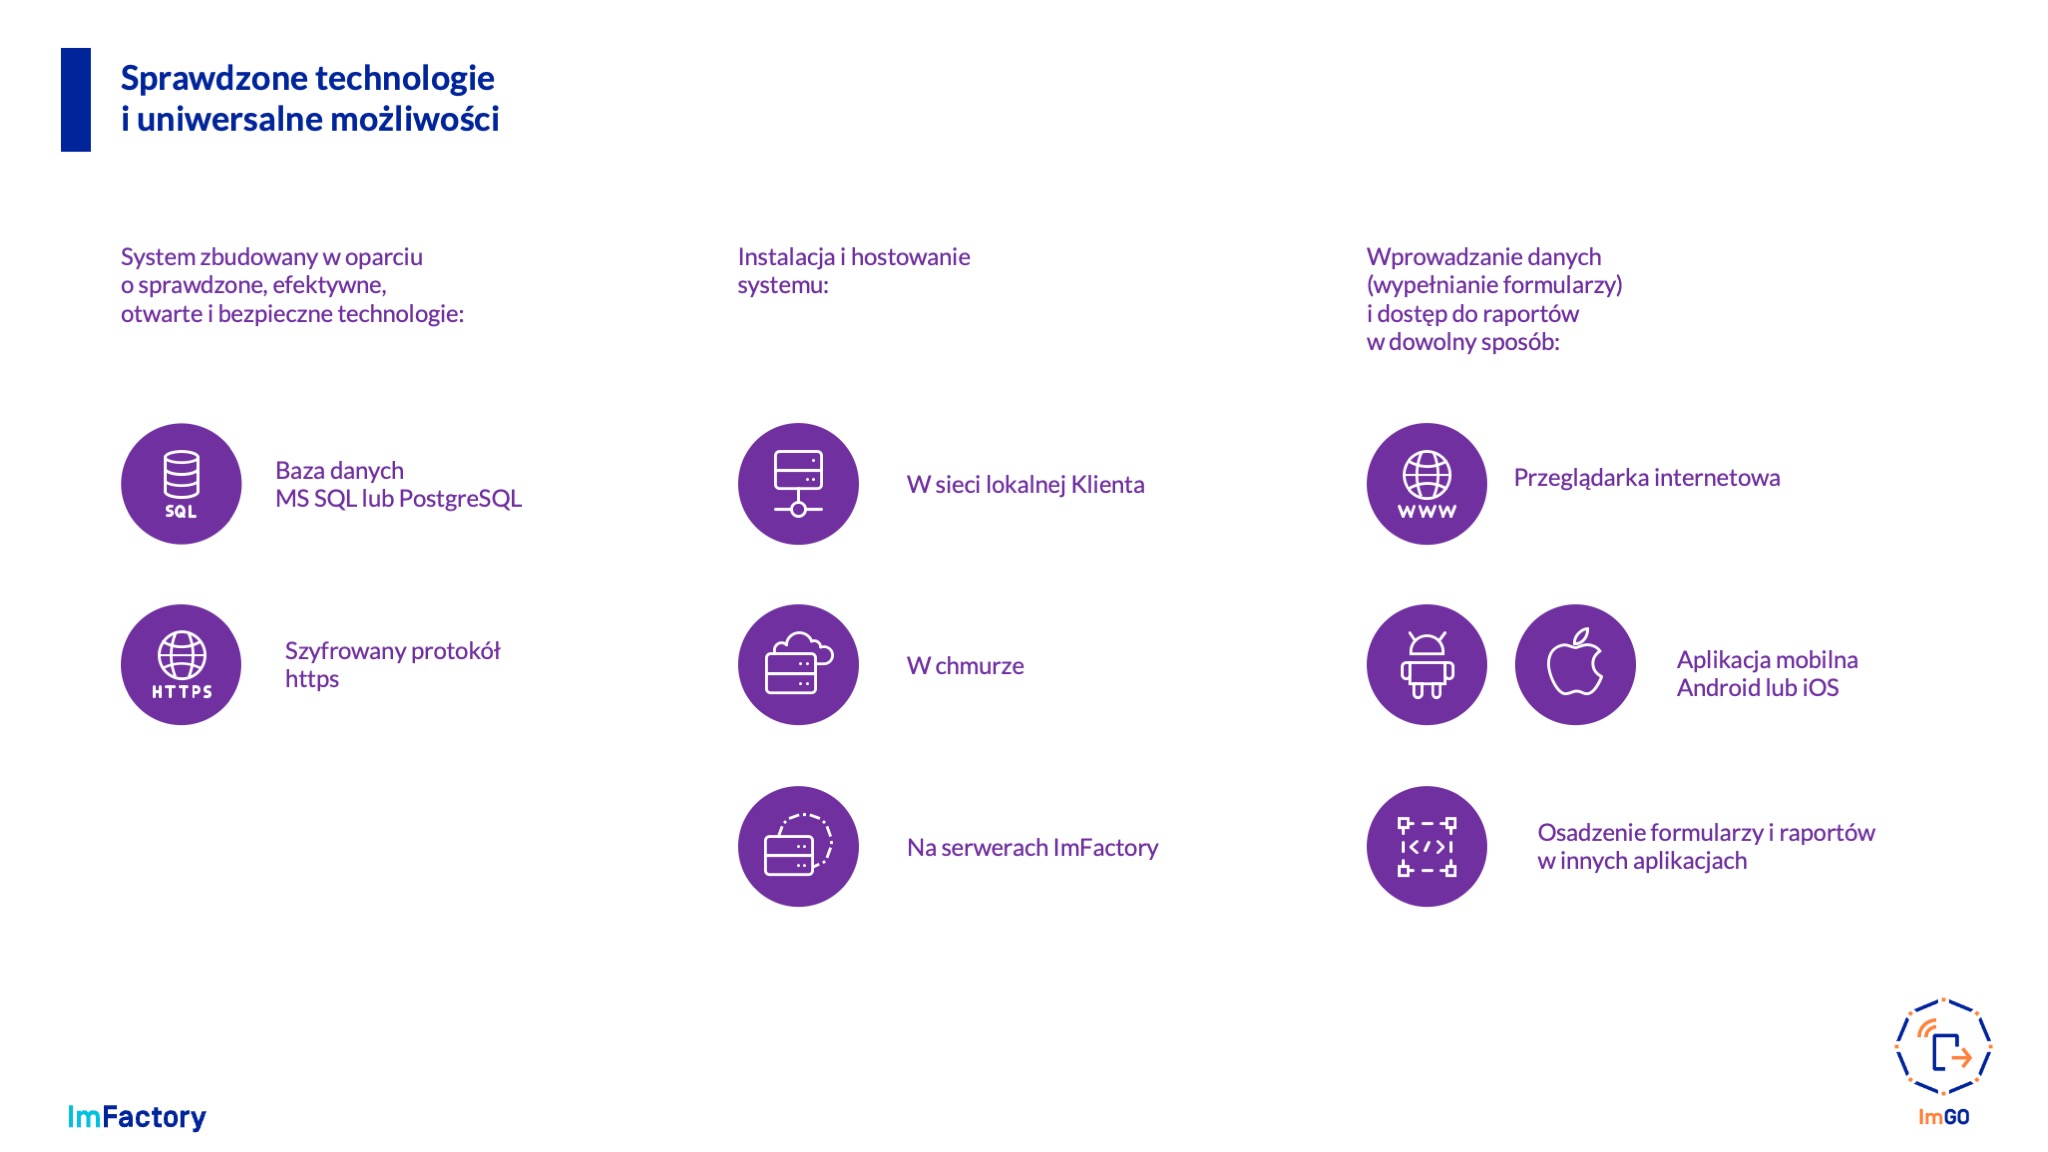
Architecture
Proven technologies with versatile capabilities
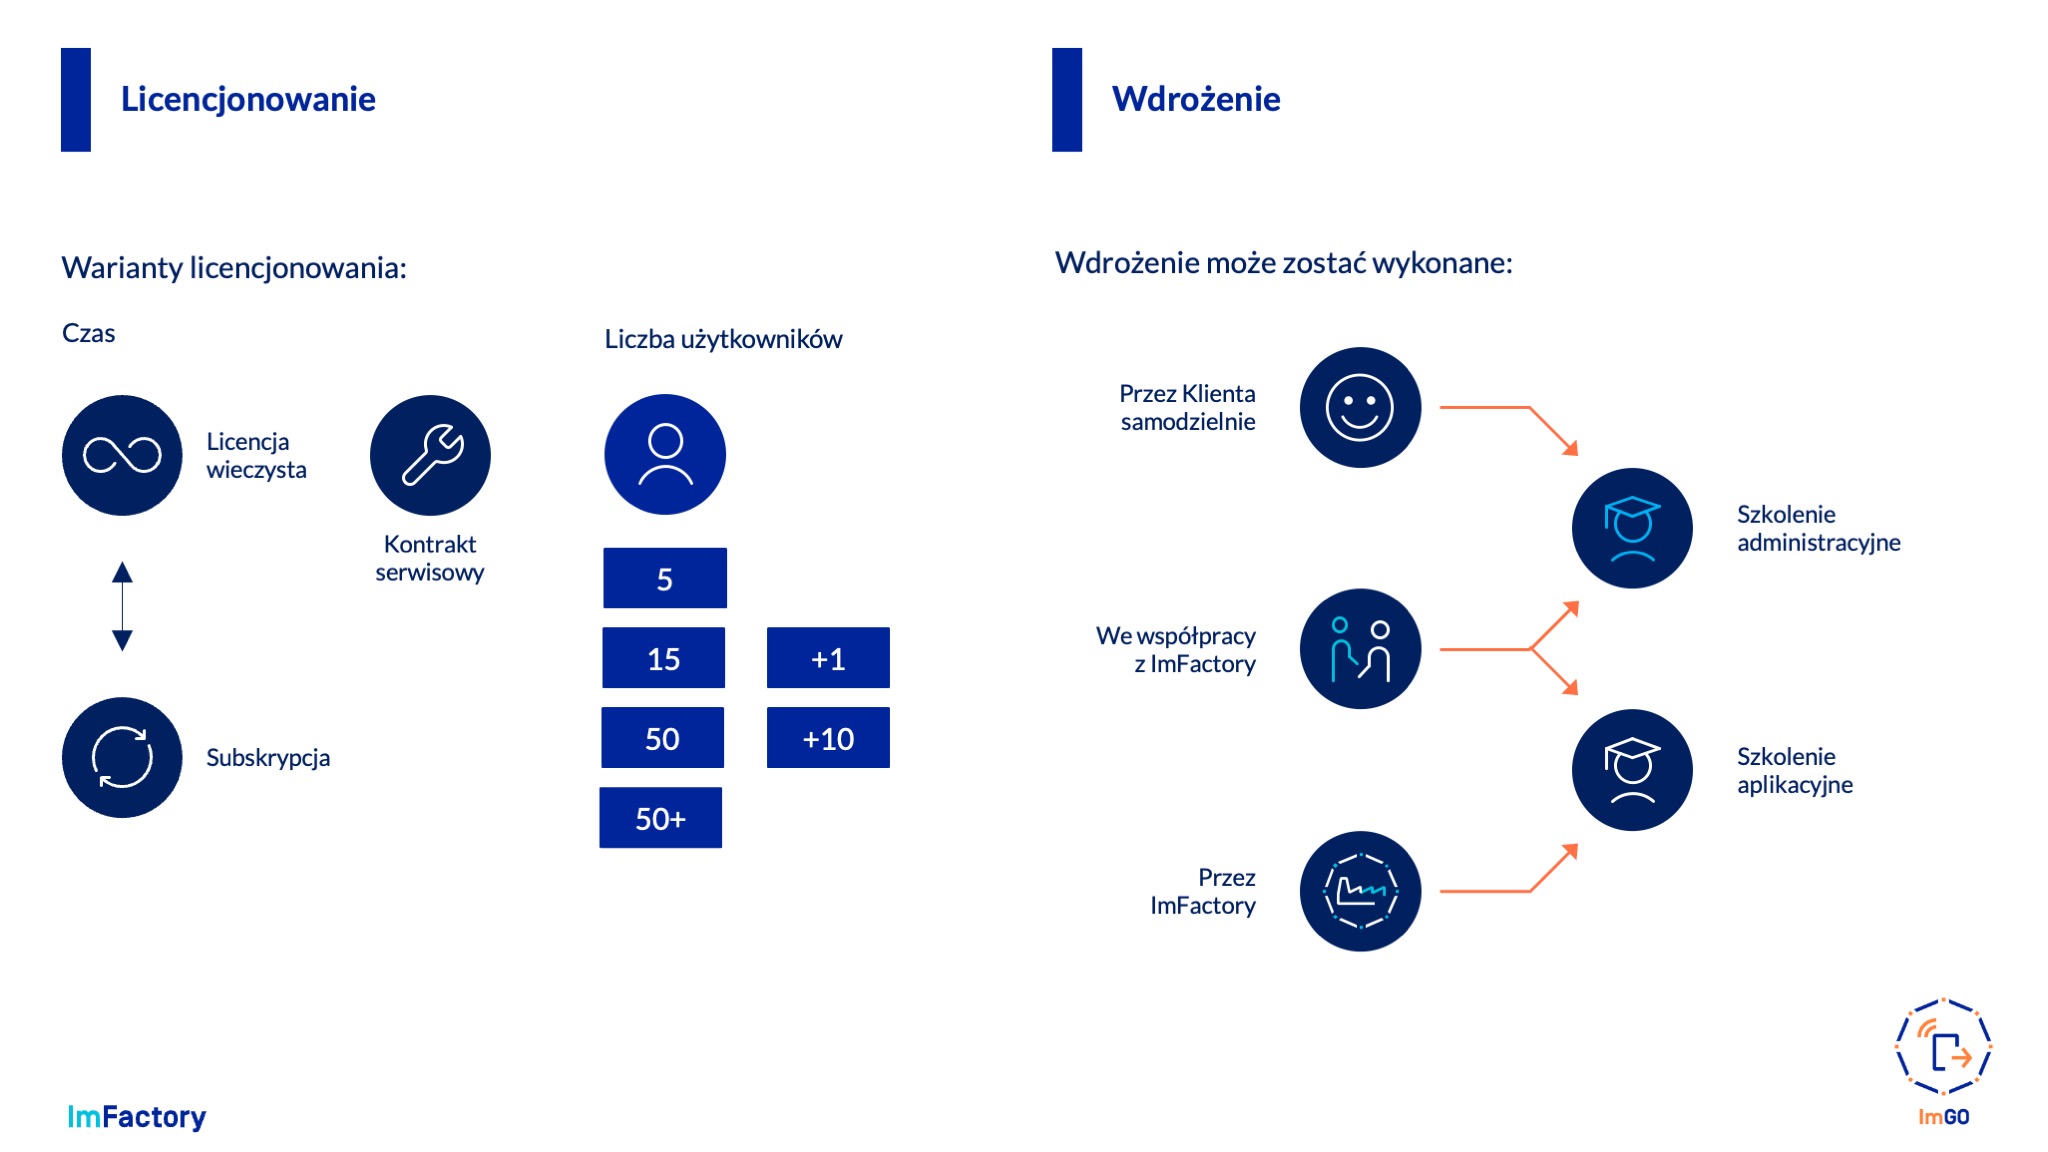
Licensing and implementation
Different variants of licensing and implementation
Ask the expert
Find out why we created ImGo and who it is for
“ImPortal was created out of the need to access a simple and light, but flexible tool that allows users to effectively provide them with all reporting and analytical information about the operation of their production systems in a readable form that varies depending on the type of information.”
“ImPortal was created out of the need to access a simple and light, but flexible tool that allows users to effectively provide them with all reporting and analytical information about the operation of their production systems in a readable form that varies depending on the type of information.”

Thinking about machine monitoring? Try the ImProdis MES system now!
Starter kit for monitoring of 5 machines starts from as little as PLN 21,000 per year.
Ask for price
What do we deliver to our clients? How are we operating?
Articles
Curious to learn more? Explore our Knowledge Base, where you’ll discover articles and webinars prepared by experts that will allow you to expand your knowledge.


FAQ
See what customers interested in the ImPortal system most frequently ask about and expand your knowledge on this topic.
ImPortal is a digital, mobile information flow and reporting system for supporting the management and supervision processes of an organization’s facilities, employees and resources.
The main benefit of ImPortal is the company’s successful digital transformation at the level of replacing paper and spreadsheet with mobile forms and a database system.
The ImPortal system is a database system, so it can integrate with any other such system. Both as a provider and client of data. A common practice is to implement the ImGo system as a mobile interface for entering information into the company’s existing system, which does not have such functionality
The ImPortal system implementation project, like any other project, begins by determining what problems, needs or challenges the system needs to respond to and to what extent. Only after determining these issues we can begin the work of defining the main users, stakeholders of the project or conducting an inventory of the machines and systems in our possession, as well as specifying specific requirements. At this stage, an external consultant can be invited to help.
It is a good idea to start implementing the ImPortal system by preparing a demo in the form of Proof of Concept or Proof of Value. This means implementing the system in a version that is limited in functionality or area, but in a scope that will prove that it meets the main objectives of the project. This is the stage of the business case for the investment, resulting in the delivery of the so-called MVP (Minimal Value Proposition).
The price of the ImPortal system depends on a number of factors and can range from a few thousand to even a few dozen thousand PLN. The main factors determining the price of the ImGo system include the number of users, objects and forms functional scope, the method of licensing (perpetual or subscription) or the method of hosting (local, cloud, hybrid).
The first implementations of the ImPortal system took place in companies managing a distributed structure of facilities, namely in the plumbing and heating industries. Then came implementations in many manufacturing companies in the furniture, automotive, food and other industries, among others.
Post-implementation support is divided into warranty and post-warranty (service). Regardless of the period, post-implementation support consists of service processes called SR (Service Request), which include preparation of fixes and workarounds for reported bugs, software version updates, system performance monitoring – in general, all issues related to ensuring continuity of operation in accordance with SLA provisions. The second stream of requests handled are the so-called FRs (Functional Requests), which involve making improvements, optimizations, changes in configuration or adding new functions or areas – that is, system expansion in the broadest sense. In addition, consultants visit the plant, check how the system is being used and collect feedback directly from users.
Typical areas of development of the ImPortal system are: – addition of new functions that have not yet been implemented, – extension of the system to new areas, e.g. departments that have not yet been digitized, – integration with external systems for which communication channels have not yet been established. These areas can, of course, occur in various combinations and scopes.
ImPortal stores data in a standard Microsoft SQL or PostgreSQL database, access to which is open to users with the appropriate level of authorization. Thanks to this, without the slightest problem, the ImPortal database can be connected as a data source to any BI solution, as well as other tools such as Excel sheets, Google Sheet, Minitab or Statistica.
Check if Digital Transformation is the Answer to Your Company’s Needs