What Is and What Is Not Traceability? The Most Common Myths
Growing quality requirements, increasingly stringent legal regulations, and customer expectations regarding production transparency mean that traceability is becoming one of the pillars of modern production management. Despite this, many misconceptions still surround it. Companies often invest in it while only partially implementing the idea of product traceability.
Production Under Scrutiny: What Traceability Tells Us
What exactly is traceability, and what can it offer to manufacturing companies? What areas of the process does it cover, and what are its types? Is it merely a regulatory requirement – or a practical tool supporting production efficiency and safety?
From Paper Documentation to Full Traceability. The Digital Transformation at OnlyBio.life
Millions of items annually, hundreds of formulas, continuous product launches, adherence to strict quality standards and GMP requirements, multiple legal obligations – this is the reality of many FMCG companies. In such an environment, traceability is no longer a nice-to-have addition, but a necessity. Moreover, its dependable performance is the condition for a business’s stable growth.
Digital Technologies and Strategies for Increasing Energy Efficiency
We live in an era of spectacular changes — Technological, Economic, and Business-related. Changes we can prepare for, and those that surprise us day by day.
Boost Productivity with AI. ImFactory and Braincube
Your manufacturing data may hold far greater potential than you think. Find out how to unlock it and genuinely boost efficiency — without costly investments in new infrastructure.
It goes without saying that efficient manufacturing translates into real profits for the entire company. But how do we know if we are utilizing the full production potential? How to calculate it, and what to compare it to? This is where the Overall Equipment Effectiveness (OEE) comes to the rescue – it is one of the most commonly used production efficiency indicators.
Of course, it is important to understand how the OEE is constructed. How do we calculate it? What are its variations? However, it is not the definitions of formulas that are the crucial aspect here. The fundamental question is: why do we want to measure OEE at all? Similar to projects, performance measurement systems need to have their purpose, value and desirable outcome defined.
Why is it worth measuring and monitoring the OE?
Let’s start with an example. Imagine that we bought a brand new machine. We waited for it for months, and it wasn’t a cheap purchase. The manufacturer declared that with this new equipment we would be able to manufacture 1000 units per each working hour. So we expected the waiting time and the investment to pay off quickly. However, it turned out that we can only yield 554 pieces per hour. The question arises: “What went wrong?”
Dr Peter Drucker, one of the most prominent management experts and theorists, author of numerous books, including “The Practice of Management” and “The Effective Executive”, used to say: “If you can’t measure it, you can’t improve it”. That’s why measuring our machine will not only help us answer why it’s not producing the expected quantity, but, more importantly, what we can do to make it work as intended. And this knowledge is provided by the OEE.
The definition of OEE: how it is, vs. how it should be
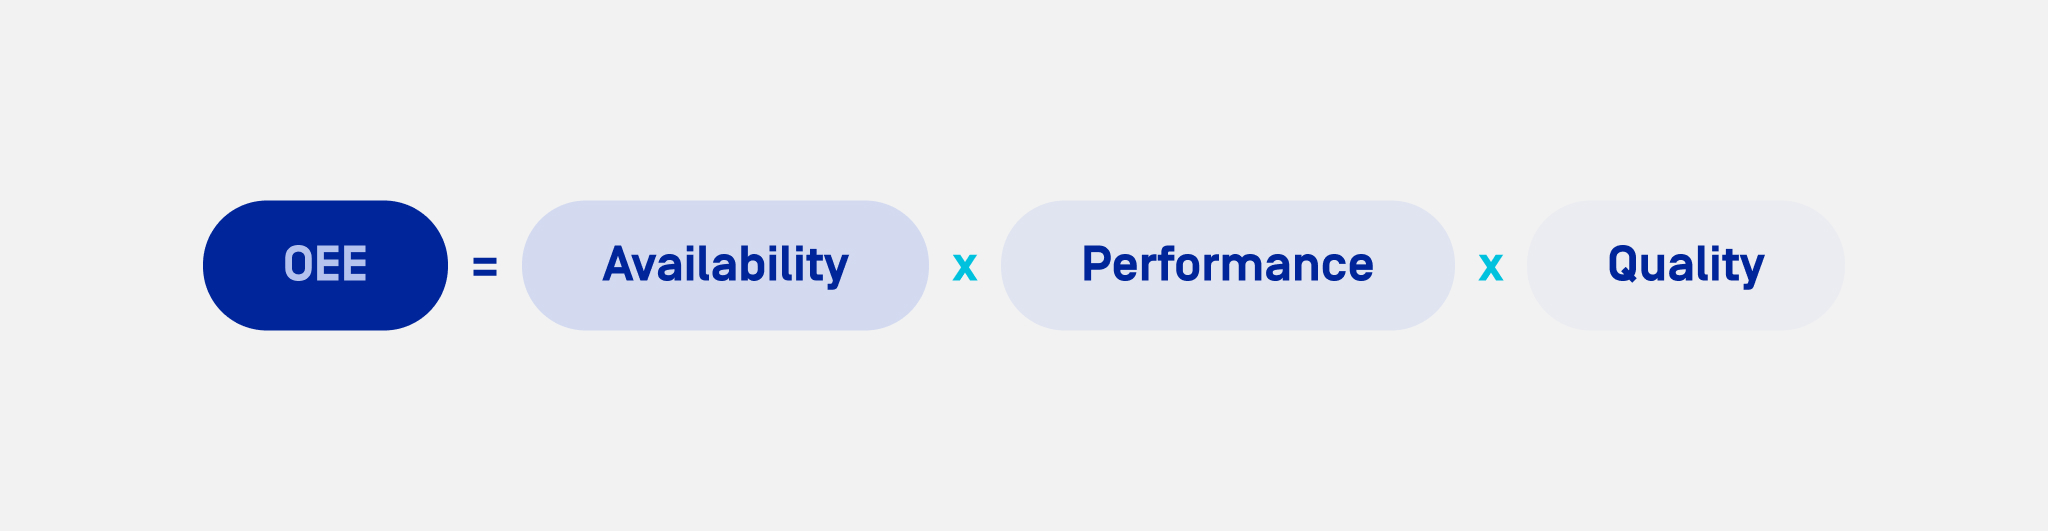
We use the Overall Equipment Effectiveness to measure the efficiency of our machines and equipment. It is defined as the product of three factors: Availability, Performance and Quality. While OEE can be calculated manually, more and more manufacturing companies use specialized IT systems, such as Manufacturing Execution Systems (MES), which monitor the equipment’s operations in real time and calculate production indicators at any given moment. When such a system has been properly implemented and is stable, OEE calculations are fully automated and the obtained results are reliable.
Let’s go back to our machine. We connected it to the monitoring system and received information that the OEE is at 55% – only half of the nominal value. It’s a signal that there is room for improvement. The question is, where exactly? To answer this, let’s analyze the report below more closely. We can see the values of each factor. It turns out that the availability was at 95%, and the quality was also close to 95%. These results are very satisfactory. However, the performance was only at 61% – and this is the field for improvement, as it is where the largest losses occur. It is now apparent where the actions can be taken to improve the results.
What are the OEE factors?
We already know that OEE is a product of three factors. Let’s take a closer look at what they really are, what information they provide, and what we can do to prevent losses in these areas.
Availability – the first OEE factor
The first factor, availability, provides information about the time associated with the inability to perform work. Based on our example of an inefficient machine, let’s assume that we work one shift for 8 hours a day. During the shift, there is one 20-minute lunch stop, two stops for the start and end of the shift, and a 15-minute TPM stop. After subtracting these stops, we obtain the time available for work.
Unfortunately, the world is not perfect. Let’s assume that during the day, there was a 10-minute breakdown due to the material feeder jam, then there was a short power outage, resulting in an additional 2-minute downtime, and the machine stopped three times for 2 minutes each, but the operator did not specify the reason, and there was no automatic error code.
Only after subtracting these unplanned downtimes do we get the actual runtime. Thus, the availability factor is nothing more than the ratio of the time remaining after deducting losses to the time scheduled for production. In our hypothetical case, converting hours to minutes, we calculate the percentage value of the ratio of these two values, resulting in the availability level of 95%.
Performance – the second OEE factor
Performance, which is the second OEE factor, provides information about the losses related to a loss of production rate. We are working continuously, but below the standard rate. The basis for calculating performance is the operational time, which is the time dedicated to work. It is deducted by the extra time spent on production, due to the operator inefficiency, incorrect machine settings, or micro-stoppages.
What remains is the so-called net runtime, which is the time when production reached 100% capacity. Performance is the total count, which is both good and bad count, divided by the potentially achievable count within the operational time. In our example, as mentioned at the beginning, the nominal rate is 1000 pieces per hour. The run time amounts to 6.9 hours. Therefore, our theoretical production is 6900 pieces. However, the actual registered production per hour is 4225. The ratio of these two values is 61.23%, which represents our performance.
By analyzing the components of the OEE indicator, we have identified the source of our problem. How to prevent it then? There are several ways to increase performance, including:
⦁ Limiting the number of tasks in progress,
⦁ Improving the flow of raw materials and work in progress,
⦁ Identifying and eliminating bottlenecks, especially on production lines,
⦁ Automating processes
⦁ Investing in new machinery and equipment.
Quality – the third OEE factor
The third OEE factor, quality, provides information about the losses related to poor production or to pieces that are reworked as its result. The basis for calculating this component is the net time, which is the time remaining after deducting performance losses from the previous step. Quality losses mainly refer to defects, errors, such as those arising from assembly, start-up rejects, process rejects, and any kind of rework. All of these are subtracted from the net run time, and the result is final, fully productive time.
In this understanding, the quality is the ratio of good count to total count. In our case, there were 4225 pieces recorded, of which a good count was 4005 pieces, so our quality is 94,97%.
How to improve quality? With the helps of the following tools:
⦁ Poka–Yoke, which is designing processes in an error-proof way, like the proverbial SIM card which cannot be inserted incorrectly thanks to a cut corner.
⦁ Jidoka, which is incorporating methods into the process to detect and correct irregularities before they progress further in the process.
⦁ Root Cause Analysis,which involves searching for the most common defects and identifying their causes to eliminate them from the process.
⦁ Standardized Work and the implementation of solutions like One Point Lessons, which support quality assurance within in the process.
How to calculate OEE from the perspective of time losses?
As mentioned before, the OEE formula is calculated by multiplying its components. However, in addition to the results, we can also take a closer look at losses, which is a common approach when considering the OEE. In this context, we can discuss total loss, availability loss, performance loss and quality loss.
Let’s consider the OEE from the perspective of planned production time. By subtracting all unplanned stops, we get the actual runtime. Then, by subtracting the time spent on non-productive work, we are left with the time during which we produce goods at a designated speed. Going further, by subtracting the time spent on defective, bad, or substandard production, we get the truly productive manufacturing time, that is the time spent on good quality production. This is our OEE indicator, calculated from the perspective of time losses.
Variations of OEE
The OEE is not the only indicator of production effectiveness. Other indicators are: Overall Operation Effectiveness (OOE) and Total Effective Equipment Performance (TEEP) .
All three indicators – OEE, TEEP i OOE – take into account the three factors of quality, performance and availability. The main difference lies in how availability is defined for each of them.
⦁ Maximum availability for OEE is the planned production time, i.e. the time allocated for the machine to operate.
⦁ Maximum availability of OOE is the planned production time (similar to OEE), but extended to include the time not planned for production: planned downtimes, TPM, and other maintenance operations.
⦁ Maximum availability for TEEP assumes 24/7 machine operation, 365 days a year – making it the broadest indicator.
And so?
The OEE and its factors play a significant role in monitoring manufacturing processes. What is more, OEE can be measured for individual equipment as well as entire production lines. Continuous monitoring of OEE levels allows you to stay on top of things and, in case of any efficiency issues, quickly identify their source and take appropriate action. This ensures that everything operates as it should, in line with plans and expectations.
Board Member, Head of Product and Digital Consulting
At ImFactory, he also acts as a Project Manager and consultant. He is responsible for shaping the vision for the development of IT systems in production environments. He supports companies in assessing their digital maturity and helps them plan their digital transformation.
A graduate of the Gdańsk University of Technology, he completed a degree in Automation and Robotics and completed postgraduate Lean Six Sigma Black Belt studies. He is the author of numerous publications under the #EffectiveDigitization banner. He shares his knowledge on production efficiency, digital transformation, MES/MOM systems, and digitalization roadmaps.
He combines technical knowledge with an understanding of business processes, effectively supporting companies on their journey to the Digital Factory.
Michał Zieliński’s articles and webinars are available in the ImFactory Knowledge Base.
See also
Want to learn more? Visit our Knowledge Base, where you'll find articles and webinars by experts to expand your knowledge.
Check if Digital Transformation is the Answer to Your Company's Needs
Free Consultation
Thank you for submitting the form.
Our account manager will contact you within 1 business day to learn more about your challenges and schedule an appointment with the consultant best suited to your needs.
While you’re waiting, we encourage you to go to ImFactory’s Knowledge Base, where you’ll find many interesting webinars, articles and case studies that will introduce you to the world of Digital Transformation